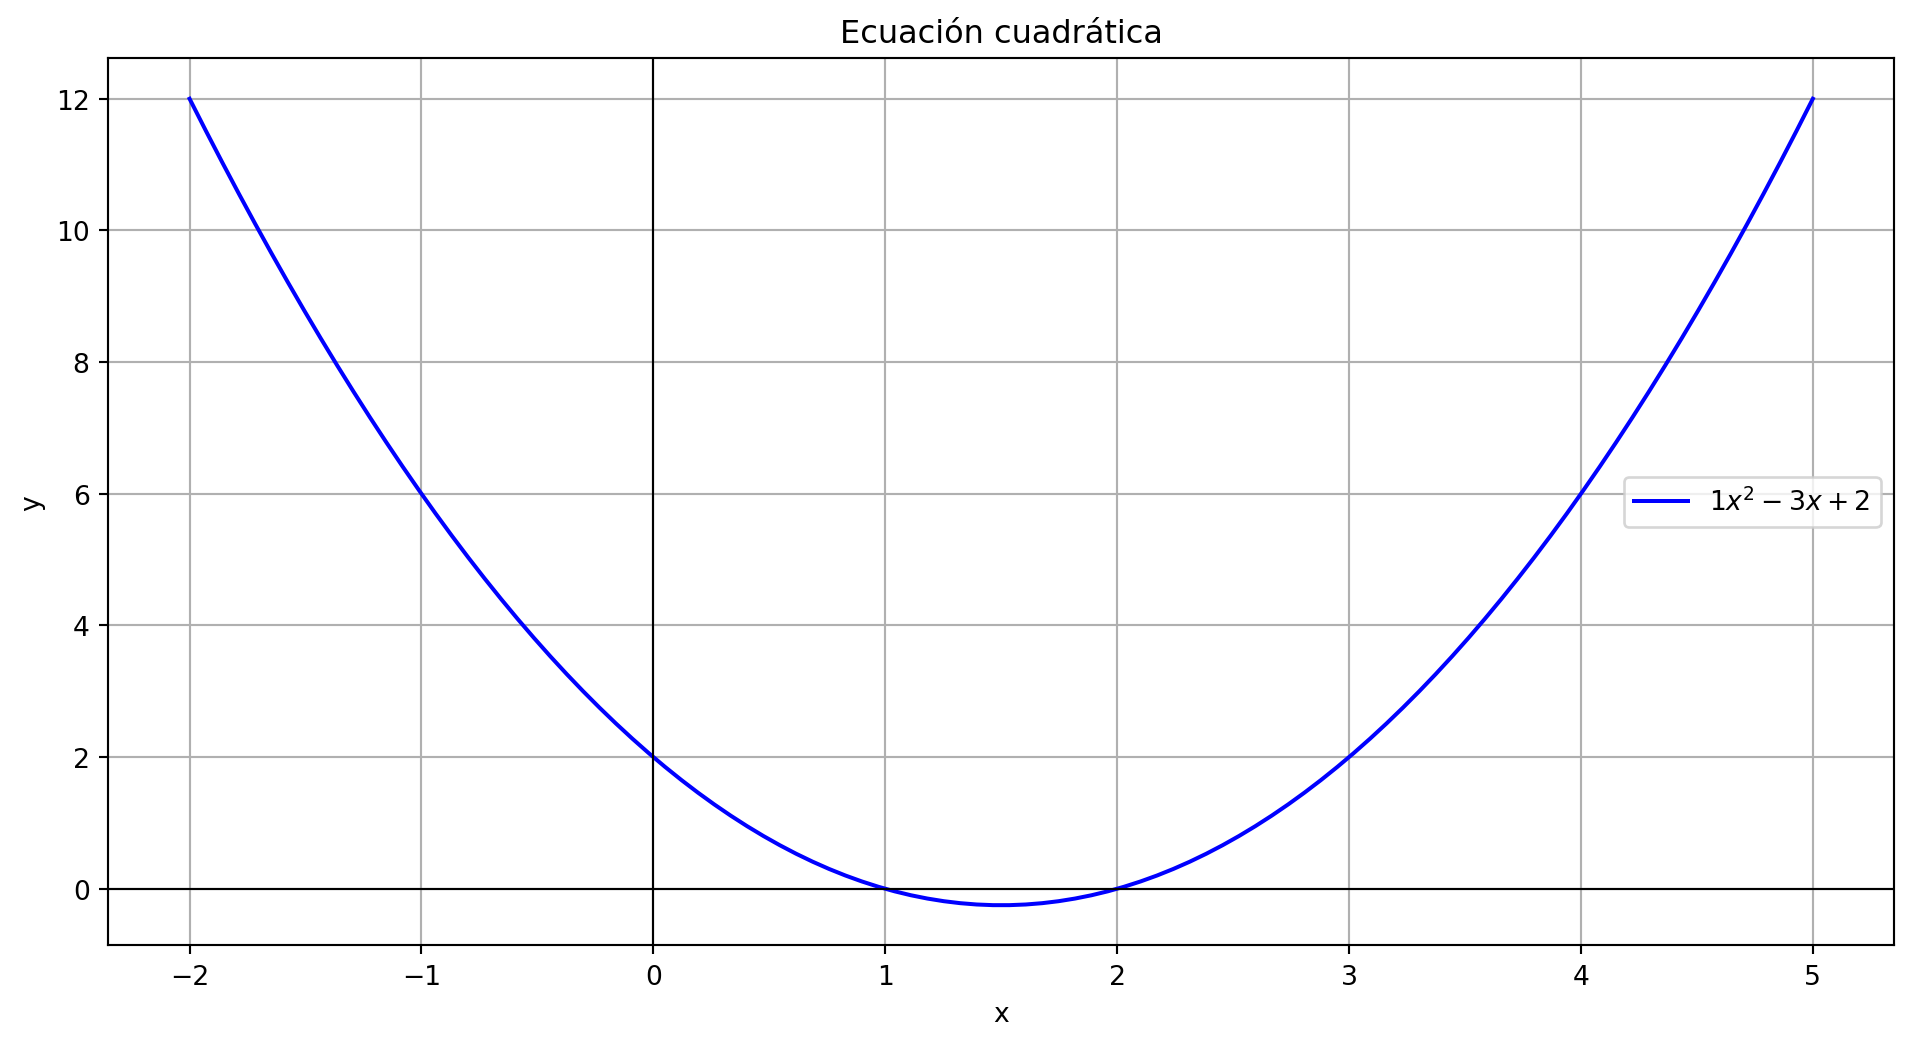
import seaborn as sns
import matplotlib.pyplot as plt

mpg = sns.load_dataset("mpg")
sns.scatterplot(data=mpg, x="horsepower", y="mpg")
plt.show()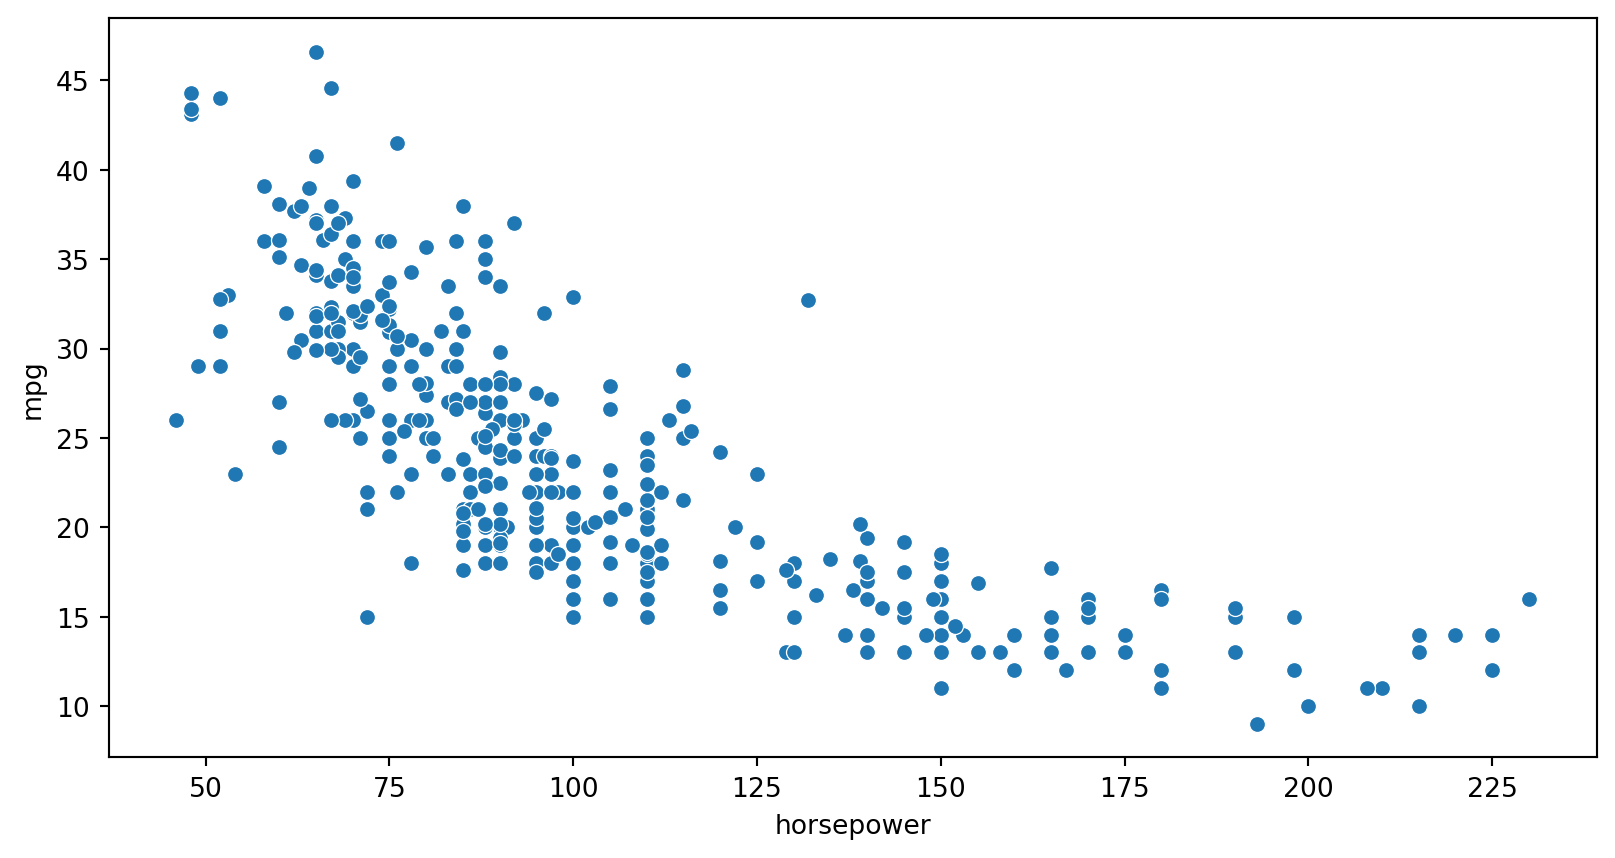

![]()
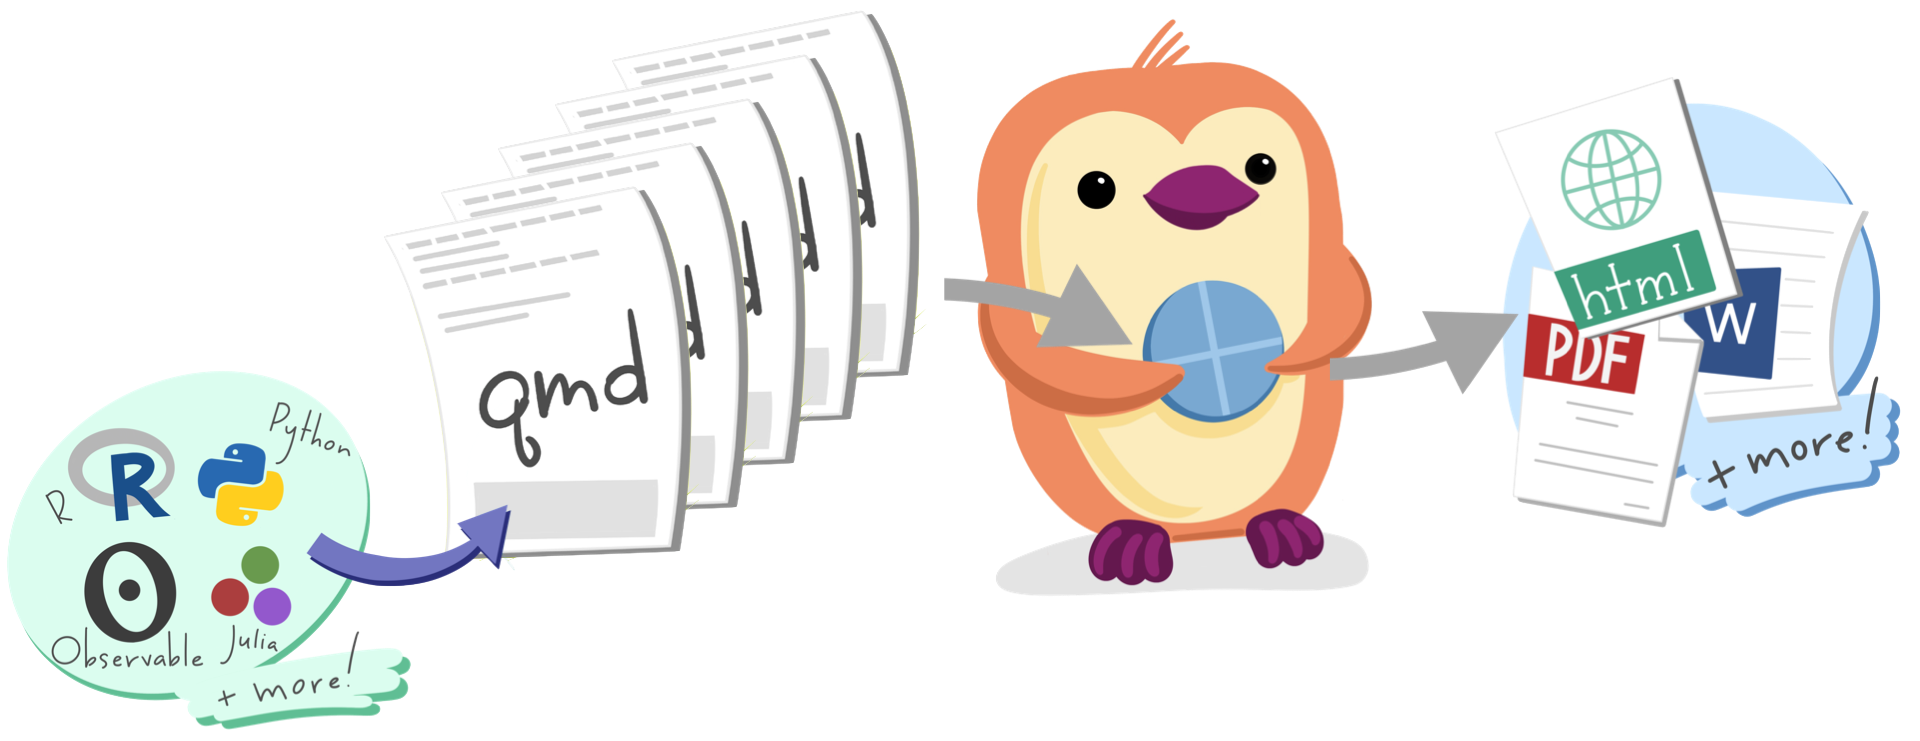
Quarto es un sistema abierto de
publicación científica y técnica
el objetivo es hacer que el proceso de creación
y colaboración sea drásticamente mejor
 Un solo documento, múltiples formatos: HTML, PDF, presentaciones o sitios web.
 Materiales más accesibles y fáciles de usar, con soporte para la enseñanza y la inclusión.
 Fácil de aprender: usa Markdown simple y cuenta con ayudas para empezar rápido.
 Flexibilidad total: integra texto, imágenes y código en R, Python, Julia u otros lenguajes.
quarto check en la terminal
import seaborn as sns
import matplotlib.pyplot as plt
mpg = sns.load_dataset("mpg")
sns.scatterplot(data=mpg, x="horsepower", y="mpg")
plt.show()
Crea bloques con pestañas que permiten alternar entre distintos contenidos.

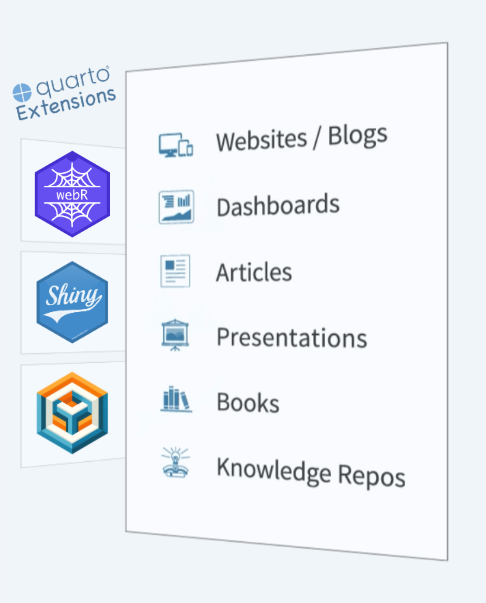
Las extensiones de Quarto permiten añadir nuevas características y potenciar su uso.
🔧Necesitas más poder? Usa Extensions
La extensión Quarto Quiz permite crear preguntas directamente en tus presentaciones.
📚 Más info: Quarto Quiz Extension
Shiny es un paquete de R que permite crear de manera sencilla aplicaciones interactivas usando R
(también disponible para Python).
📚 Más info: Shiny - Posit
Sigue en tu presentación.
No pierdas el ritmo 🎯
Compartir: Un mismo .qmd genera HTML, PDF, slides o sitios web, pasando de lo estático a lo interactivo.
Colaborar: Con un archivo sencillo ya se puede crear y publicar material reproducible, iniciando el trabajo en equipo.
Enseñar: Sus features integran texto, código y visualizaciones, mejorando la enseñanza con recursos dinámicos.
Reimaginar: Tecnologías como WebR, Pyodide o Shiny abren nuevas formas de aprender e innovar en educación.
Documentación oficial
🔗 quarto.org
Guías y ejemplos prácticos para comenzar de inmediato.

Aprendizaje en video
🔗 Crash Course en YouTube
Introducción práctica a Quarto y sus distintos usos.

Recursos de la comunidad
🔗 Mine Cetinkaya-Rundel
Cursos, libros y presentaciones en Quarto en GitHub.

Aplicaciones en educación
🔗 sethnut.com/resources
Olimpiada Matemática, Verano Matemático, EMMA y más!
🔗 Nuestro Sitio Web: sethnut.com/talks