


From Data to Narrative
Interactive Storytelling with Shiny
2025-04-09
Agenda
No
Nope
Jamás

¿Qué es el Storytelling?
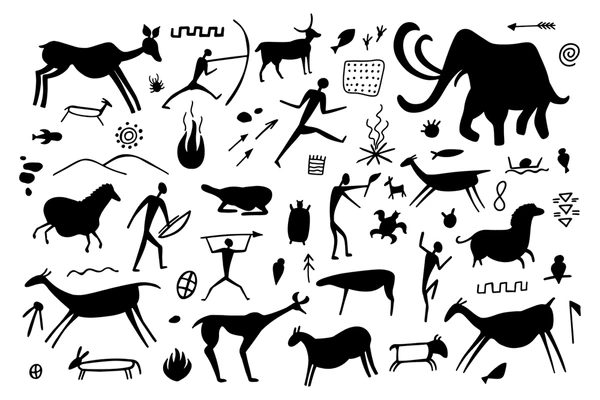

🔥 Las historias son la primera tecnología humana
Esos cerebros tan hackables…
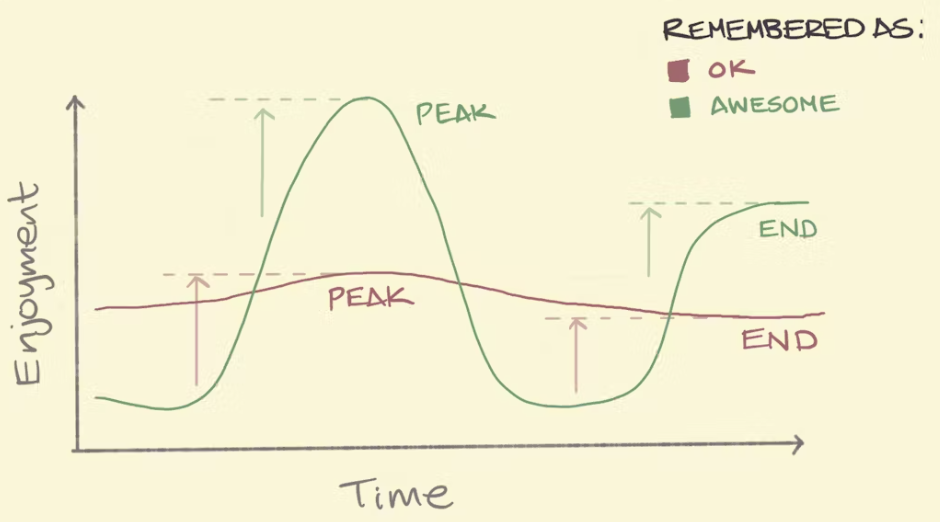
Regla del máximo y final (Peak-End Rule)
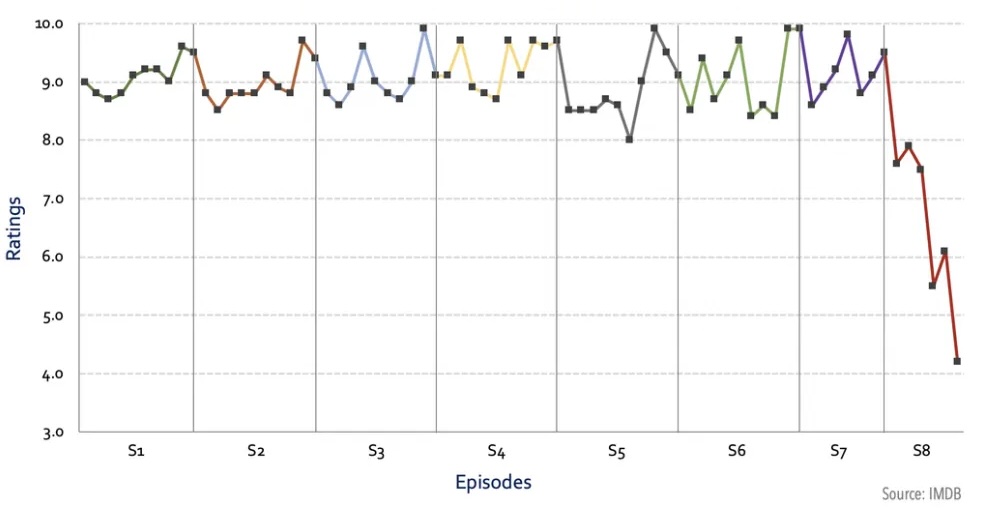
Rating de Game of Thrones, por Kelvin Neo
Narrativa
Usar trucos de Storytelling (narrativa) para crear presentaciones que serán recordadas y que causarán impacto

🎭 Las emociones generan acciones
El mejor ejemplo

¿Podemos hacer que millones de personas compartan estadísticas en redes sociales?

Ejemplos
 🔢 No compartas números
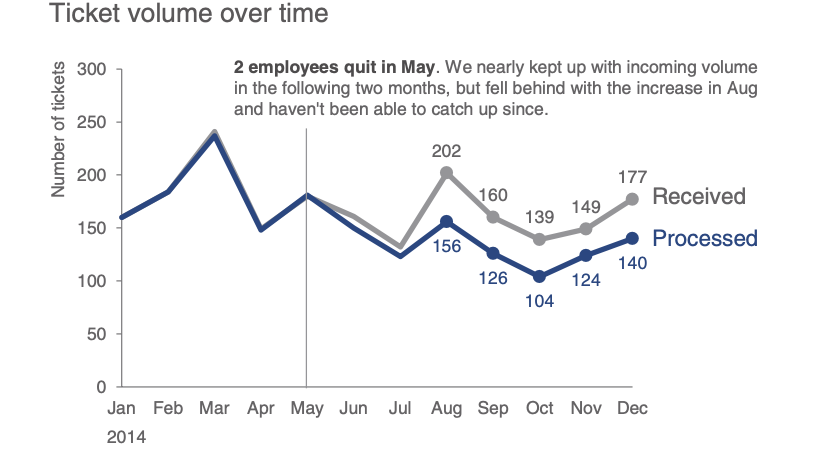 🪶Comparte una historia
(C) Storytelling with Data, por Cole Nussbaumer Knaflic.
Ejemplos


🥱 1° versión \(<\) … \(<\) 😊 última versión
Usar chatbots de IA para:
- Plantillas personalizadas a medida
- Automatizar estructura del contenido
- Ahorro de tiempo en diseño
- Adaptación al estilo y preferencias

💡 Chatbots A.I. - Ideas
Usar chatbots de IA para:
- Analogías y ejemplos
- Mejores traducciones
- Prompts para crear imágenes
- No busques imágenes, créalas!

💡 Chatbots A.I. - Imágenes
Quarto
Quarto es un sistema abierto para publicaciones científicas con markdown y código interactivo (Python/R).

Ejemplos

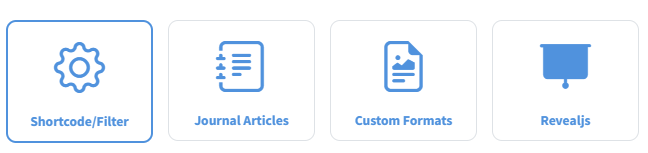
Quarto Extensiones
Las extensiones son una herramienta poderosa para modificar y ampliar el comportamiento de Quarto.
🌐 Quarto WebR y Quarto Pyodide
Shiny
Shiny es un paquete de R que permite crear aplicaciones web interactivas fácilmente usando R (También disponible para python).

Shiny
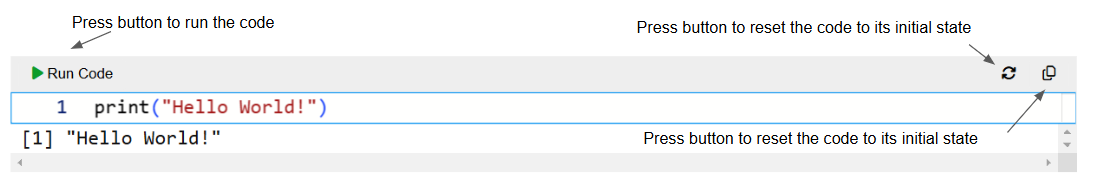
🌐 Quarto Shinylive
Código para desplegar aplicaciones Shiny que se ejecutarán completamente en el navegador, utilizando Pyodide y webR (Python y R compilados a WebAssembly).
R: Ejemplos de Shinylive en R
Python: Ejemplos de Shinylive en Python
🎉 ¡Gracias por Participar!

🔗 Nuestro Sitio Web: seth-nut.github.io/resources.